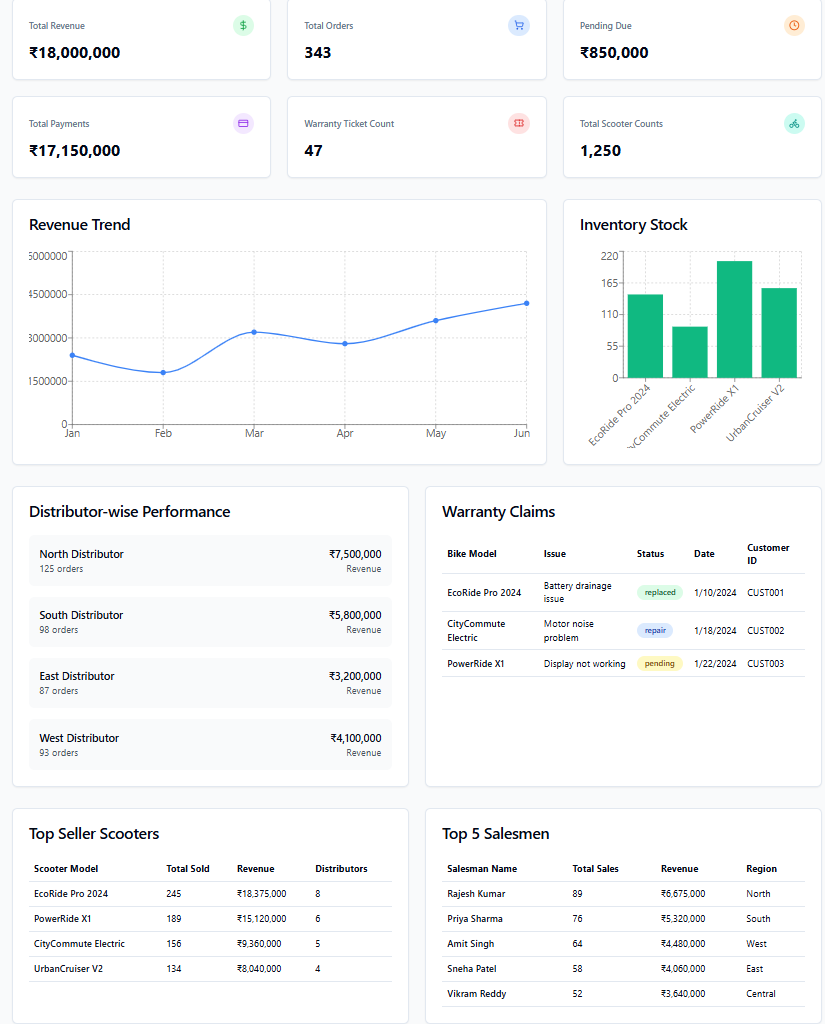
Dashboard (Admin)
Author(s)
- Sanket Mal
- Dipak Mourya
Last Updated Date
2025-06-17
SRS References
Version History
| Version | Date | Changes | Author |
|---|---|---|---|
| 1.0 | 2025-06-17 | Initial draft | Sanket Mal, Dipak Mourya |
Feature Overview
Objective:
Provide a real-time, actionable dashboard for EV bike B2B business users, summarizing orders, revenue, warranty, inventory, dealer performance, top sellers, and salesmen.
Scope:
- Dashboard is read-only, focused on analytics and reporting.
- No direct data manipulation from dashboard.
- Data is aggregated from backend APIs.
Dependencies:
- Backend APIs
- Responsive web frontend
Requirements
- Display total orders, revenue summary, warranty summary, and total scooter count as widgets.
- Show revenue and inventory trends over a selected date range.
- List dealer performance, top scooter sellers, and top salesmen for a date range.
- All date filters are via query parameters (
startDate,endDate). - Dashboard must be responsive and role-aware.
Design Specifications
-
UI/UX Design:
- Four main widgets: Total Orders, Revenue, Warranty, Inventory.
- Two charts: Revenue by Month, Inventory by Model.
- Three tables: Dealer Performance, Top Scooter Sellers, Top Salesmen.
- Date range picker at the top.
-
Data Models:
public record OrdersStats
{
  public int TotalOrders { get; init; }
  public Dictionary<PurchaseRequestStatus, int> StatusWiseOrderCounts { get; init; } = new();
}

public record RevenueStats
{
  public decimal TotalOrderAmount { get; init; }
  public decimal TotalPayments { get; init; }
  public decimal PendingDue { get; init; }
}
public record WarrantyStats
{
  public int TotalTicketCount { get; init; }
  public int RepairedCount { get; init; }
  public int RejectedCount { get; init; }
  public int ReplacedCount { get; init; }
  public int ProcessingCount { get; init; }
}
public record ScooterSalesSummary
{
  public int TotalScooterSold { get; init; }
}
public record RevenueData
{
  public decimal Revenue { get; init; }
}
public record DealerPerformanceData
{
  public string DealerName { get; init; } = string.Empty;
  public string DealerCode { get; init; } = string.Empty;
  public int DealershipType { get; init; }
  public int OrderCount { get; init; }
  public decimal TotalOrderAmount { get; init; }
}
public record TopSellingScooter
{
  public string ProductId { get; init; } = string.Empty;
  public string ProductName { get; init; } = string.Empty;
  public string ProductCode { get; init; } = string.Empty;
  public string Model { get; init; } = string.Empty;
  public int TotalSold { get; init; }
  public decimal TotalOrderAmount { get; init; }
}
public record TopSellingModels
{
  public required string Model { get; init; };
  public int TotalSold { get; init; }
}
public record TopSalesman
{
  public string SalesManagerId { get; init; } = string.Empty;
  public string SalesManagerName { get; init; } = string.Empty;
  public int TotalOrders { get; init; }
  public int TotalSales { get; init; }
  public decimal TotalOrderAmount { get; init; }
  public string Region { get; init; } = string.Empty;
} -
API Interfaces:
Endpoint Method Parameters Response Status Codes /api/dashboard/orders/totalGET startDate, endDate (query) OrdersStats200, 500 /api/dashboard/revenue/summaryGET startDate, endDate (query) RevenueStats200, 500 /api/dashboard/warranty/summaryGET startDate, endDate (query) WarrantyStats200, 500 /api/dashboard/sales/summaryGET startDate, endDate (query) ScooterSalesSummary200, 500 /api/dashboard/revenueGET startDate, endDate (query) List<RevenueData>200, 500 /api/dashboard/inventoryGET startDate, endDate (query) List<InventoryItem>200, 500 /api/dashboard/dealers/performanceGET startDate, endDate (query) List<DealerPerformanceData>200, 500 /api/dashboard/top-selling-scootersGET startDate, endDate (query) List<TopSellingScooter>200, 500 /api/dashboard/top-selling-modelsGET startDate, endDate (query) List<TopSellingModel>200, 500 /api/dashboard/top-salesmanGET startDate, endDate (query) List<TopSalesman>200, 500 -
Third-Party Integrations:
-
Workflow:
- User logs in and lands on dashboard.
- Dashboard fetches summary widgets (orders, revenue, warranty, inventory).
- User selects date range; dashboard fetches charts and tables for that range.
- Data updates in real time as filters change.
Backend Development Tasks & Estimates
| No | Task Name | Estimate (Hours) | Dependencies | Notes |
|---|---|---|---|---|
| 1 | Planning for Dashboard Feature | 2 | None | Requirements, API, DB design |
| 2 | Develop: Get Total Orders API | 2 | Task 1 | /api/dashboard/orders/total |
| 3 | Test: Get Total Orders API | 1 | Task 2 | |
| 4 | Develop: Get Revenue Summary API | 2 | Task 1 | /api/dashboard/revenue/summary |
| 5 | Test: Get Revenue Summary API | 1 | Task 4 | |
| 6 | Develop: Get Warranty Summary API | 2 | Task 1 | /api/dashboard/warranty/summary |
| 7 | Test: Get Warranty Summary API | 1 | Task 6 | |
| 8 | Develop: Get Total Scooter Count API | 2 | Task 1 | /api/dashboard/inventory/total-scooters |
| 9 | Test: Get Total Scooter Count API | 1 | Task 8 | |
| 10 | Develop: Get Revenue by Month API | 4 | Task 1 | /api/dashboard/revenue |
| 11 | Test: Get Revenue by Month API | 1 | Task 10 | |
| 12 | Develop: Get Dealer Performance API | 4 | Task 1 | /api/dashboard/dealers/performance |
| 13 | Test: Get Dealer Performance API | 1 | Task 12 | |
| 14 | Develop: Get Top Selling Scooter API | 4 | Task 1 | /api/dashboard/top-selling-scooter |
| 15 | Test: Get Top Selling Scooter API | 1 | Task 14 | |
| 16 | Develop: Get Top Salesmen API | 4 | Task 1 | /api/dashboard/top-salesman |
| 17 | Test: Get Top Salesmen API | 1 | Task 16 | |
| 18 | Documentation for Dashboard Feature | 3 | All above | |
| 19 | Create 4 mock APIs for dashboard statistics, including Total Orders, Warranty Summary, Revenue, etc. | 2 | ||
| 20 | Create a mock API for dashboard Revenue data graph. | 1 | ||
| 21 | Create a mock API for dashboard Inventory data graph. | 1 | ||
| 22 | Create a mock API for dashboard Distributor-wise performance data. | 1 | ||
| 23 | Create a mock API for dashboard Warranty Claims data. | 1 | ||
| 24 | Create a filter for date range selection on the dashboard. | 1.5 | ||
| 25 | Create a UI screen for the dashboard page to display graphs. | 2 | ||
| 26 | Create a UI screen to display admin statistics. | 1 | ||
| 27 | Create a UI screen to display the Warranty table, Top Sellers, Top Distributors, and Top Scooter Sales. | 4 | ||
| 28 | Ensure all API responses are properly tested and the UI responds correctly with loaders, error messages, etc. Also, ensure correct integration of Faker APIs and server APIs from both frontend and backend. | 2 | ||
| 29 | Develop: Get Top Selling Model API | 4 | Task 1 | /api/dashboard/top-selling-model |
| 30 | Test: Get Top Selling Model API | 1 | Task 29 | |
| 31 | Develop and Mock API for top selling model | 1 | Task 1 | /api/dashboard/top-selling-model |
| 32 | Add a top selling model table in Dashboard UI and Test it | 1.5 | Task 1 | |
| Total | 61 |
Testing & Quality Assurance
-
Unit Tests:
- X unit
-
Integration Tests:
- End-to-end dashboard data flow
- Role-based UI
-
Acceptance Criteria:
- All widgets, charts, and tables display correct data for selected date range.
- UI is responsive and adapts to user role.
-
Testing Tools:
Deployment Considerations
-
Configuration Changes:
- API base URL
-
Rollout Plan:
- Deploy to staging, verify with test users, then production.
Risks & Mitigations
| Risk | Impact | Likelihood | Mitigation Strategy |
|---|---|---|---|
| API downtime | High | Medium | Fallback UI, error messages |
| UI performance on mobile | Medium | Medium | Optimize rendering, lazy load |
Review & Approval
-
Reviewer:
Abhishak Kumar Roy -
Approval Date:
2025-07-03